Linear equations in two variables and functions
Rectangular coordinate system
We draw graphs of data by using two intersecting perpendicular lines called rectangular coordinate system. The horizontal and the vertical lines are called $x$-axis and $y$-axis respectively.The point, where the two axes intersect is called the origin. At the origin, both the $x$ and $y$ values are 0. On the $x$-axis, the numbers to the right of the $y$ axis are positive and that to the left are negative. On the $y$ axis, numbers above the $x$-axis are positive and the numbers below are negative. The axes divide the plane of the graphing area into four regions called quadrants.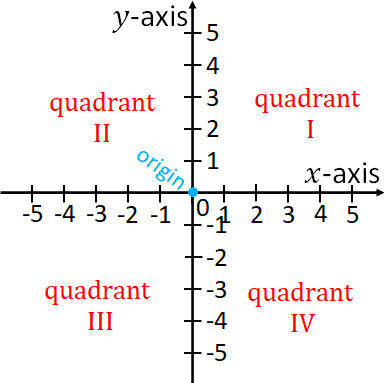
Linear equations in two variables
Standard form of a linear equation of two variables is$Ax+By=C$
where $x$ and $y$ are the variables and $A$,$B$ and $C$ are real numbers.The $x$ and the $y$ values that make the equation a true statement is the solution of the equation. The solution is written as ordered pair as $(x,y)$, i.e., the $x$ value first and then the $y$ value.
$x$ and $y$-intercepts
$x$-intercept is a point where a graph intersects the $x$ axis. Since at the $x$-axis, $y=0$, an $x$-intercept is in the form $(a,0)$.To find the $x$-intercept put $y=0$ in the equation and solve for $x$, if the solution is $a$, then the $x$ intercept is $(a,0)$.
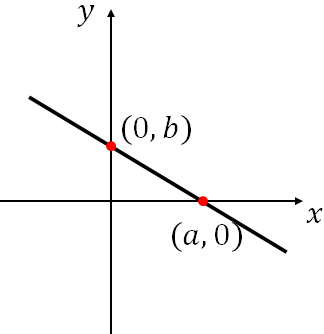
$y$-intercept is a point where a graph intersects the $y$ axis. Since at the $y$-axis, $x=0$, an $y$-intercept is in the form $(0,b)$.
To find the $y$-intercept put $x=0$ in the equation and solve for $y$, if the solution is $b$, then the $y$ intercept is $(0,b)$.
Horizontal and vertical line
The graph of the equation $y=k$, where $k$ is a constant, is a horizontal line.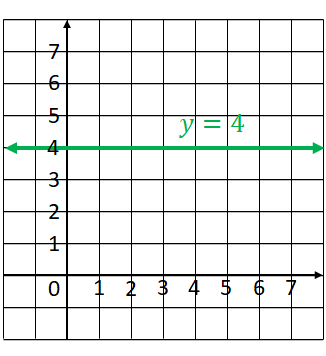
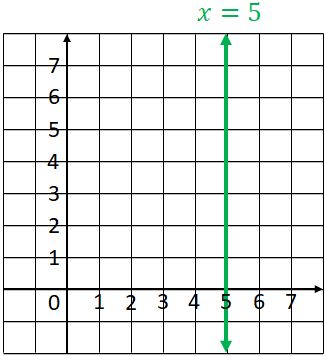
The equation of the vertical line in the figure above is $y=4$ as any point on the line, $y$ is $4$.
The graph of the equation $x=k$, where $k$ is a constant, is a vertical line.
Slope of a line
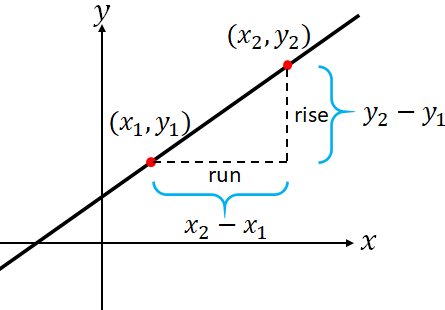
Slope of a line is the ratio of the change in $y$ to the change in $x$. i.e., rise over run.$slope =\dfrac{change \:in\: y}{change\: in\: x}$$=\dfrac{rise}{run}$
To find the slope of a line, we need two points. If a line passing through the points $(x_1,y_1)$ and $(x_2,y_2)$, then the slope of the line, $m$ is
$m=\dfrac{y_2-y_1}{x_2-x_1}$
Parallel and perpendicular lines
If two lines are on a plane and they do not intersect, then they are parallel lines.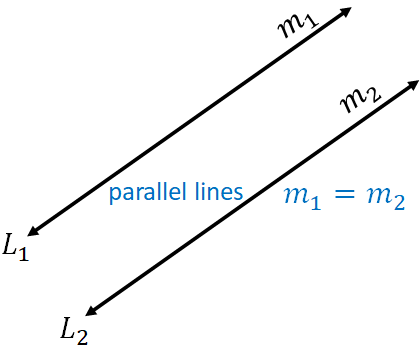
Slope of parallel lines are the same. i.e., if $m_1$ and $m_2$ are the slopes of two parallel lines, then
$m_1=m_2$
If two lines intersect at a right angle, they are perpendicular lines.
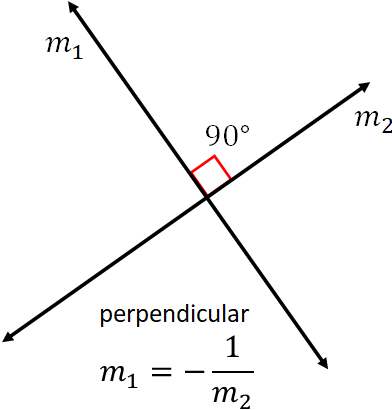
If $m_1$ and $m_2$ are the slopes of two perpendicular lines, then
$m_1 \,m_2=-1$
or$m_1=-\dfrac{1}{m_2}$
Equations of a line
The standard form of an equation of a line is$Ax+By=C$
There are other two forms: slope-intercept form and point-slope form.Slope-intercept form
An equation of the form:$y=mx+b$
is the slope-intercept form.where $m$ is the slope of the line and $(0,b)$ is the $y$-intercept of the line.
Point-slope form
An equation of a line of the form:$y-y_1=m(x-x_1)$
is the point-slope form.The above equation is called point slope formula. If you know the slope of a line and a point, $(x_1,y_1)$ on the line , then you can use this formula to find the equation of the line.
Relations
In the following table, average values of a woman's height and normal weight is given.| height in cm | weight in lb |
|---|---|
| 152 | 105 |
| 163 | 127 |
| 172 | 144 |
| 180 | 157 |
From the table, we see that the height 152 cm corresponds to a weight of 105 lb, the height 163 cm corresponds to a weight of 127 lb and so on. Such a correspondence is called a relation.
The relation between the height and weight are written as ordered pairs, {(152, 105), (163, 127), (172, 144), (180, 157)}, the first component is the height and the second component is the weight.
In a relation, the set of the first components in the ordered pairs is called the domain of the relation, and the set of the second components is called the range of the relation.
So, for the above example, the domain is $\{152,163,172,180\}.$
and the range is $\{105,127,144,157\}.$Example: In the following figure, there is a relation between two sets of numbers displayed in a different way.
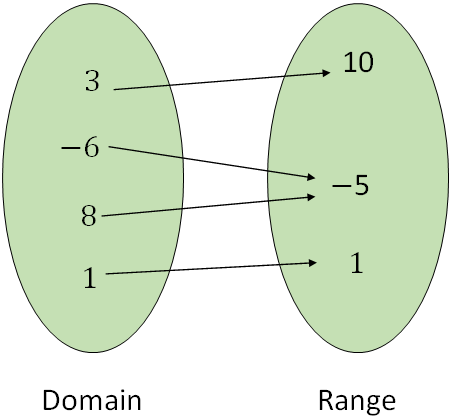
{(3,10), (-6,-5), (8,-5),(1,1)},
i.e., for each ordered pair, the element of the domain is written first and then the corresponding element of the range.
Functions
If in a relation, where each element of the domain corresponds to only one element in the range, then we call that relation a function.Example:1 Determine whether the following relation is a function.

Answer: Yes, the above relation is a function as each element in the domain corresponds to exactly only one element in the range.
Example:1 Determine whether the following relation is a function.

Answer: The relation is not a function as the element 'plum' in the domain corresponds to more than one element of the range.
We can draw the graph of a function with the ordered pairs. But not all the graphs represent a function. We can use the 'vertical line test' to determine whether a graph is function or not.
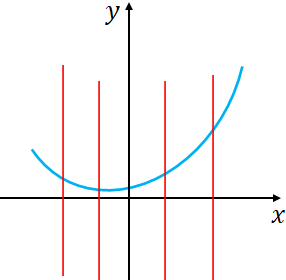
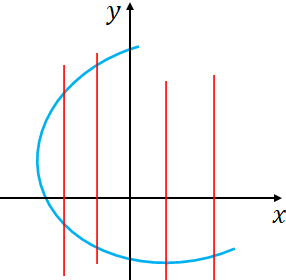
Vertical line test
A graph is a function, if a vertical line no matter where you draw, does not cross the graph more than once. If a vertical line crosses the graph more than once, then the graph is not a function.Example 1: The following graph represents a function.
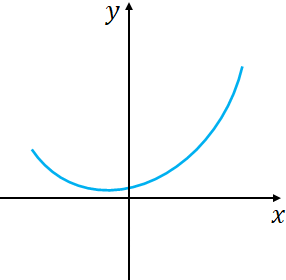
There is no vertical line that you can draw, crosses the graph more than once.
Example 2: The following graph does not represent a function as you can draw vertical lines, which cross the function two times (more than once).
Function notation
Functions are often defined as equations.For example, the equation, $y=4x$ represents a function. It is written as
$f(x)=4x$, read as $f$ of $x$.
where $f$ is the name of the function. $x$ is the input value from the domain of the function. You can use any letter for the function.Evaluating a function
If we have a function, say,$f(x)=5x$
and if you substitute $x=5$, you get$f(4)=5\cdot 5=20$
This is what is called evaluating the function, i.e., we evaluated the function at $x=5$.Finding function values from a graph
From the graph of a function, $f(x)$, we can find the function value for a given $x$ value. Also, if you know the function value, you can find the corresponding $x$ value(s).Example: The graph of a function, $g(x)$ is given below, (a) Find $g(0)$, (b) Find $g(-2)$ (c) Find, for what value of $x$ is $g(x)=0$ and (d) Find, for what value of $x$ is $g(x)=3$.
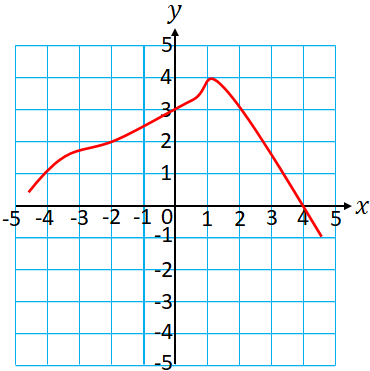
Solution:
(a) $g(0)$ is the $y$-value for $x=0$.
Therefore, $g(0)=3$
(b) $g(-2)$ is the $y$-value for $x=-3$.
Therefore, $g(-2)=2$.
(c) $g(x)=0$ means $y=0$. In the graph, $y=0$ at $x=4$, so the answer is $x=4$.
(d) $g(x)=3$ means $y=3$. In the graph, $y=3$ at $x=0$ and at $x=2$ , so the answer is $x=0$ and $x=2$.
Domain and range of a function
If we have a function, $y=f(x)$, then the domain of the function is all the $x$ values that when substituted into the function produce a real number.Range of the function is the set of all the $y$ values corresponding to the $x$ values in the domain.
When finding the domain of a function, keep following guidelines. If a function have a denominator, then you need to exclude the $x$ value that make the denominator zero. If a function has a square root, then you need to exclude the $x$ values that make the expression within the square root negative.
Example 1:Find the domain of the function:$f(x)=\dfrac{x+3}{2x-3}$
Solution:When finding the domain, you need to exclude the $x$ value that makes the denominator of the function zero.
So, take the denominator, set that equal to zero and solve for $x$:
$2x-3=0$
Solving for $x$, we get
$x=\dfrac{3}{2}$.
Now, the domain is all the real numbers except $\dfrac{3}{2}$.
So, the domain is $\big(-\infty,\dfrac{3}{2}\big)\cup \big(\dfrac{3}{2},\infty\big)$
Example 2:Find the domain of the function, $f(x)=\sqrt{1-4x}$
Solution: You can have only positive value or zero inside the square root.
Therefore, $1-4x \ge 0$
Solving for $x$, we get$x\le \dfrac{1}{4}$
So, the domain is all the $x$ values less than or equal to $\dfrac{1}{4}$.The domain in the interval notation is $\big(-\infty, \dfrac{1}{4}\big]$.
Graph of functions
Linear and constant functions
A function of the form: $f(x)=ax+b$ is a linear function, because if you draw a graph for this function, you will get a line.A function of the form: $f(x)=b$, where $b$ is a constant, is a constant function.